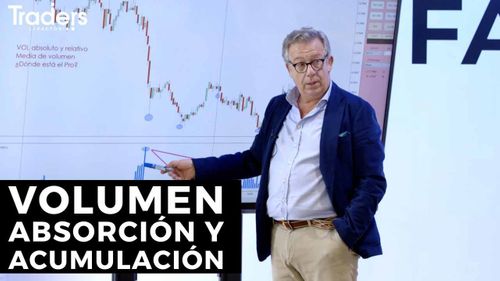
5 KEYS to UNDERSTAND a GRAPHIC | Trading Concepts

Today in CANAL TRADER we teach you how to read trading graphs like a professional trader. We discover the five basic concepts to be able to interpret them. Japanese candles, Time Frame and GAP are a few of them. Find out the rest!

Video transcription

Colored bars that go up and down. Lines in all directions. Numbers in each corner of the screen. For those who have no idea of ​​trading, a financial chart is like an abstract chart. It may seem very nice to you, but without a little information you will not know how to interpret it. Therefore, toda...

Read more

Colored bars that go up and down. Lines in all directions. Numbers in each corner of the screen. For those who have no idea of ​​trading, a financial chart is like an abstract chart. It may seem very nice to you, but without a little information you will not know how to interpret it. Therefore, today we bring you five basic items so you know how to understand a stock market chart and you can look like a true economist in front of your friends. From now on, no one will be able to tell you that you are lost in the world of the stock market. Because, yes, those bars that you see on the chart have a name. And they are called JAPANESE CANDLES. Don't worry, to interpret them you won't need to learn a foreign language or become an expert in nautical topics. These graphic representations are only named for their elongated shape and because they originate from the Japanese rice markets of the 16th and 17th centuries.

Regarding their meaning, they serve to summarize how the price of a security has evolved during a certain period of time. They mark the opening point, the closing point and the movement that has occurred between those two moments. In fact, the period covered by the candles can be modified and is known as the TIME FRAME or TIME FRAME. That is, if we work with a time frame of 15 minutes, the candle will mark the evolution of the asset's price during that time. Then a new candle will start to spawn, and so on. Therefore, to get a global idea of ​​how the market will go up or down, it is best to compare the movement of the chart using various time frames. Because we should never trust the first rumors that the candles whisper to us. As in life, you have to contrast the information.

And, once verified, it is time to decipher the TREND of the asset. Because in the end what interests us in any market is to know if it is going to go up or down, up or down. We want to find out if we have to buy at a low price to sell it at a higher price, or vice versa. And so it is important to read the direction of the graph. That is, you just have to look at the graph and see if it goes up or down. Simple enough. Even Melody's famous gorillas knew how to move their hands in those two directions. Of course, if it does not move towards either side, the value will adopt a lateral movement and will remain stagnant. But things get a little more complicated if what we want to know is the VOLUME of an asset. These bars indicate the amount of shares or contracts that are being traded at a specific time, which normally corresponds to the period defined by the candles.

If there is a lot of volume it is because there is a lot of interest in that particular asset. As if it were the hot toy of the year during Christmas weeks. On the other hand, if the volume is low, it would be like wanting to buy a scarf in summer. It is an element that must be taken into account when making trading strategies. With all these items, we can continuously read the evolution of any value. But what if suddenly there is a jump in the graph? Don't worry, this can happen and is known as GAP. Gap occurs when there is no counterpart in a price. In an upward gap the price does not find anyone who wants to sell at that price and it goes up in price until it finds the first seller willing to sell, as there have been no transactions during the price escalation, no candle is drawn and the gap remains. The same in the bearish gap but in that case there are no buyers until the price has fallen enough Another case in which the GAP occurs is between the closing and the opening of a market. As the value between one moment and the next can change radically, a blank gap is also generated. And now that you know all this, print yourself a graph and, at your next party, surprise your friends with your knowledge of the markets. Make them believe that you have become a trader or, perhaps better, take advantage of how to understand a stock chart to start your way in the world of trading and become a real trader.

Less
THE SOCIAL TRADING REVOLUTION

Learn about Social Trading

Social Trading is a new system that gives everyone access to the world's best traders. You can follow top traders and automatically copy their trades. You make money when they make money with no trading expertise required. This is the Social Trading revolution.